

This chapter is an essential guide focusing on the fundamental concepts of epidemiology, research design, and biostatistics. After reviewing this chapter, readers will be equipped with the necessary tools to understand and evaluate research studies, which is essential for evidence-based practice.
Authors: Brian Hanrahan MD, Steven Gangloff MD
Epidemiology
Distribution
Mean
- The average value of a dataset.
- Calculated by summing all values and dividing by the number of values.
- Limitations: Can be misleading in skewed distributions or distributions with outliers.
Median
- The middle value when a dataset is ordered from lowest to highest.
- Ideal for skewed distributions as it is not influenced by outliers.
Mode
- The value that occurs most frequently in a dataset.
- Ideal for skewed distributions as it is not influenced by outliers.
- Examples:
- Modal age of onset of type 1 diabetes
- Modal grade on an easy exam
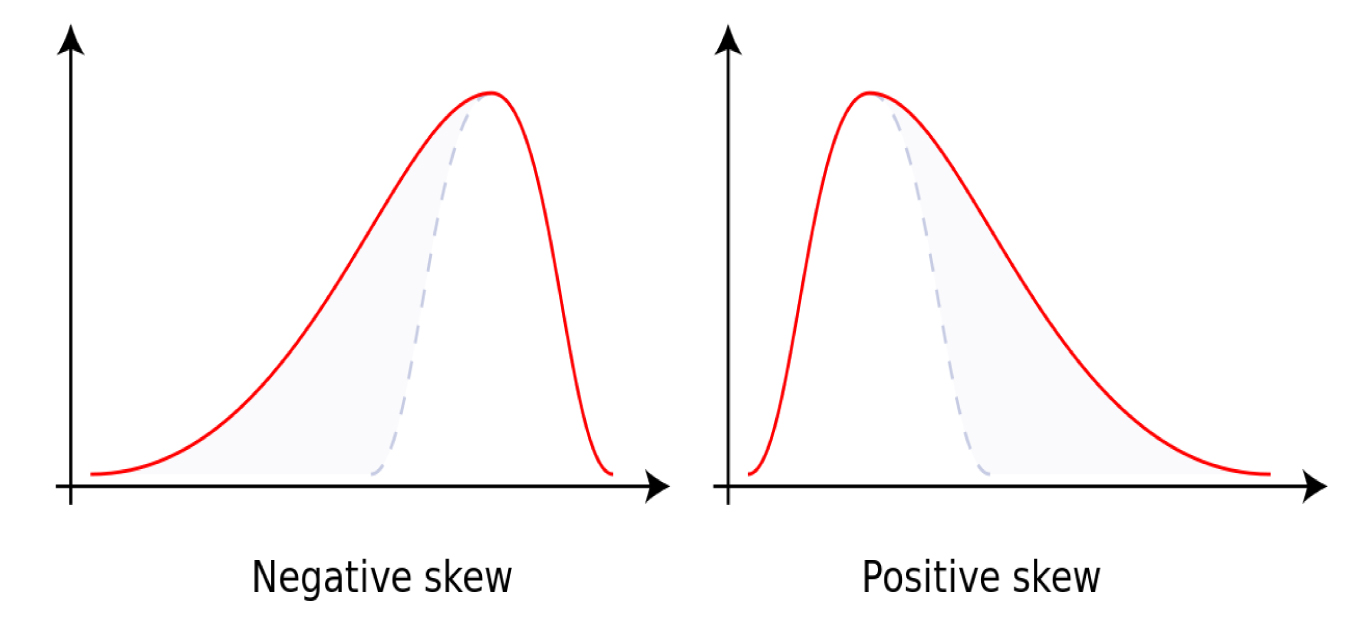
Skew
- Describes asymmetry in a distribution.
- Positive Skew: The right tail (higher values) is longer.
- Many low values and a few extremely high values.
- Mean > Median > Mode
- Negative Skew: The left tail (lower values) is longer.
- Many high values and a few extremely low values.
- Mean > Median > Mode
Incidence vs. Prevalence
Incidence
- Number of new cases of a condition in a given period.
- Useful for assessing risk and evaluating interventions aimed at preventing disease.
Prevalence
- Total disease cases (new + pre-existing) in a population at one point in time divided by the total population.
- Useful for planning health resource allocation and understanding disease burden
- Not impacted by disease duration or survival rates
- Types of prevalence:
- Point prevalence:
- Percentage of people with the condition at one specific point in time
- Better reflects the burden of chronic conditions
- Lifetime prevalence:
- Percent of individuals that ever had the condition at some point in their life
- Higher than point prevalence for chronic conditions
- Sensitive to survivorship and disease duration
- Point prevalence:

Log in to View the Remaining 60-90% of Page Content!
New here? Get started!
(Or, click here to learn about our institution/group pricing)1 Month Plan
Full Access Subscription
$142.49
$
94
99
1 Month -
Access to full question bank
-
Access to all flashcards
-
Access to all chapters & site content
3 Month Plan
Full Access Subscription
$224.98
$
144
97
3 Months -
Access to full question bank
-
Access to all flashcards
-
Access to all chapters & site content
1 Year Plan
Full Access Subscription
$538.47
$
338
98
1 Year -
Access to full question bank
-
Access to all flashcards
-
Access to all chapters & site content
Popular
Loading table of contents...
Loading table of contents...